Showing posts with label Spark Capacity Planning. Show all posts

Mar 5, 2018

Some Lessons of Spark and Memory Issues on EMR

In the last few days we went through several perfomrance issues with spark as data grow dramaticaly. The easiest way to go around might be increasing the instance sizes. However, as scaling up is not a scalable strategy, we were looking for alternate ways to back to track, as one of our Spark/Scala based pipelines strarted to crash.

Some Details About Our Process
We run a Scala (2.1) based job on a Spark 2.2.0/EMR 5.9.0 cluster w/ 64 r3.xlarge nodes.
The job analyzes several data sources each of few houndred GB (and growing) using the dataframe API and output data to S3 using ORC format. 

How Did We Recover?
Analyzing the logs of the crashed cluster resulted w/ the following error:

WARN TaskSetManager: Lost task 49.2 in stage 6.0 (TID xxx, xxx.xxx.xxx.compute.internal): ExecutorLostFailure (executor 16 exited caused by one of the running tasks) Reason: Container killed by YARN for exceeding memory limits. 10.4 GB of 10.4 GB physical memory used. Consider boosting spark.yarn.executor.memoryOverhead.

Setting the spark.yarn.executor.memoryOverhead to 2500 (the maximum on the instance type we used r3.xlarge) did not make a major change.

spark-submit --deploy-mode cluster --conf spark.yarn.executor.memoryOverhead=2500 ...

We raised the bar by disabling the virtual and physical memory checks and increasing the virtual to physical memory ratio to 4 (This is done step 1: Software and Steps of EMR creation by setting the following value of Edit software settings)
[
{"classification":"spark","properties":{"maximizeResourceAllocation":"true"}},{"classification":"yarn-site","properties":{" yarn.nodemanager.vmem-pmem-ratio":"4","yarn.nodemanager.pmem-check-enabled":"false","yarn.nodemanager.vmem-check-enabled":"false"}}
]

However, this made the magic till hitting the next limit (probably spark tasks were killed when they trying to abuse the physical memory) with the following error:

ExecutorLostFailure (executor  exited caused by one of the running tasks) Reason: Container marked as failed: container_ on host:. Exit status: -100. Diagnostics: Container released on a *lost* node 

This one was solved  by increasing the number of dataframe partitions (in this case from 1024 to 2048), that reduced the needed memory per partition.

Note: if you want to change dataframe default partitions number (200) use the following:
setConf("spark.sql.shuffle.partitions", partitions.toString)
setConf("spark.default.parallelism", partitions.toString)

If you want to take another look on the default partitioning and how to automate the numbers, take a look at Romi Kuntsman's lecture.

Right now, we run in full power ahead. yet when we may hit the next limit, it may worth an update.

Bottom Line
As Spark heavily utilizes cluster RAM as an effective way to maximize speed, it is highly important to monitor it and verify your cluster settings and partitioning strategy meet your growing data needs.

Keep Performing,
Moshe Kaplan

Nov 28, 2016

Optimizing Your Spark Cluster for Various Scenarios

Given a defined scenario for your system, how can you meet requirements?

Asking for more machines, memory and cores is always a valid idea, but your CFO may not agree and may decline your request.

"Know Your Data"
As Demi Ben Ari says: "know your data" is the answer.
You must understand your business needs to get more from your cluster.
By understading your needs you will be able to run more tasks faster.

Moreover, if you utilize cloud computing resources such as AWS, better understanding will let you select the right type of instances and getting more for same money (or even less as we will see next)

What can be controlled?
In this post, I will focus on YARN based clusters, but concepts can be applied to Mesos and stand alone clusters as well. Some more information can be found as well at Cloudera post.

How Many Nodes Do I Have?
Take a look at the number of servers installed w/ NodeManagers. This is the number of nodes you can spin (in this case we actually have 4, although there are total 8 YARN clients installed).
A node is an actual physical or virtual server (depends on your environment)

Define YARN Limitations:
yarn.nodemanager.resource.memory-mb: 
Total memory on a single node used by all executors 
(NodeMemInGB - 1)*1024

yarn.nodemanager.resource.cpu-vcores:
Total cores on a single node used by all executors
(NodeCores - 1)


Define Spark Executors Balancing
--executor-cores / spark.executor.cores: 
The number of cores per executor (number of tasks executor can run).

--executor-memory / spark.executor.memory: 
The executor memory (Actual upper limit is 64GB due to GC).
To which spark.yarn.executor.memoryOverhead will be added (default to max(384, .07 * spark.executor.memory))

Application master also requires default of 1GB and 1 core that runs on the driver and therefore we'll always decrease a single core and 1GB in our calculations. These can be controlled by the following parameters:
  --driver-memory

  --driver-cores

--num-executors / spark.executor.instances: 
The number of executors for a single job
Can be avoided using spark.dynamicAllocation.enabled

The massive interactive small data scenario
This is not a common scenario, but some people may want to run large number of tasks on relative small data.
This might not be the best practice for a Big Data, but it will provide us a good understanding of Spark cluster sizing based on this edge case.

We'll start w/ a default 4 nodes m4.xlarge 4 vCores, 16GB (on demand cost $0.239/hour of $717/month)

1. First we will maximize the resources for any given node:
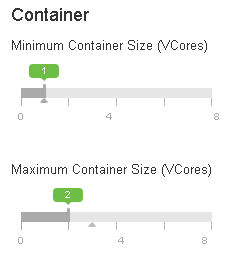
yarn.nodemanager.resource.memory-mb: (16-1)*1024 = 15,360MB
Memory Before and After

yarn.nodemanager.resource.cpu-vcores: (4-1) = 3 vCores

CPU Before and after

Containers Before and After
2. Then we will maximize the number of executors, by minimize the number of cores per executor to 1
spark.executor.cores: 1
spark.executor.memory: (16-1)*(1-0.07)/3 = 4
spark.executor.instances: 3/1*4nodes = 12 executors

The Results
After finishing configuration, we enabled 12 tasks that run 24x7 using a manual schedualer written in our lab.
As you can see number actually fit our design: CPU jumps and hits the 100%, while cluster remain stable and not crushes.


The cluster utliliuzation jump after conifiguration to 12 executors and running 8 tasks every minute


The cluster utilization hits 100% CPU w/ 11 tasks every minute


Optimizing the Instance Types
Since our bottleneck is CPU vCores, by knowing our data we should seek another type of AWS instance. c3.2xlarge is an acutal match as the C3/4 series is optimized to provide more CPU and cores for less money (a c4.2xlarge instance has w/ 8 vCores and 15GB at $0.419/hour, so for $629/month we'll get 2 c4.2xlarge nodes).

1. First we will maximize the resources for any given node:
yarn.nodemanager.resource.memory-mb: (15-1)*1024 = 14,336MB
yarn.nodemanager.resource.cpu-vcores: (8-1) = 7 vCores

2. Then we will maximize the number of executors, by minimize the number of cores per executor to 1
spark.executor.cores: 1
spark.executor.memory: (15-1)*(1-0.07)/7 = 1
spark.executor.instances: 7/1*2nodes = 14 executors

Bottom Line
With some little tweeking, we could get 17% more exectores for 12% less money, or bottom line of 33% more value/money!

Keep Performing,
Moshe Kaplan

P.S You should explore more ways to save money on this kind of architrecture by utilizing:
 - Reserve instacnes
 - Spot instances

ShareThis

Intense Debate Comments

Ratings and Recommendations